---
slug: /en/operations/monitoring
sidebar_position: 45
sidebar_label: Monitoring
description: You can monitor the utilization of hardware resources and also ClickHouse server metrics.
keywords: [monitoring, observability, advanced dashboard, dashboard, observability dashboard]
---
# Monitoring
import SelfManaged from '@site/docs/en/_snippets/_self_managed_only_automated.md';
You can monitor:
- Utilization of hardware resources.
- ClickHouse server metrics.
## Built-in advanced observability dashboard
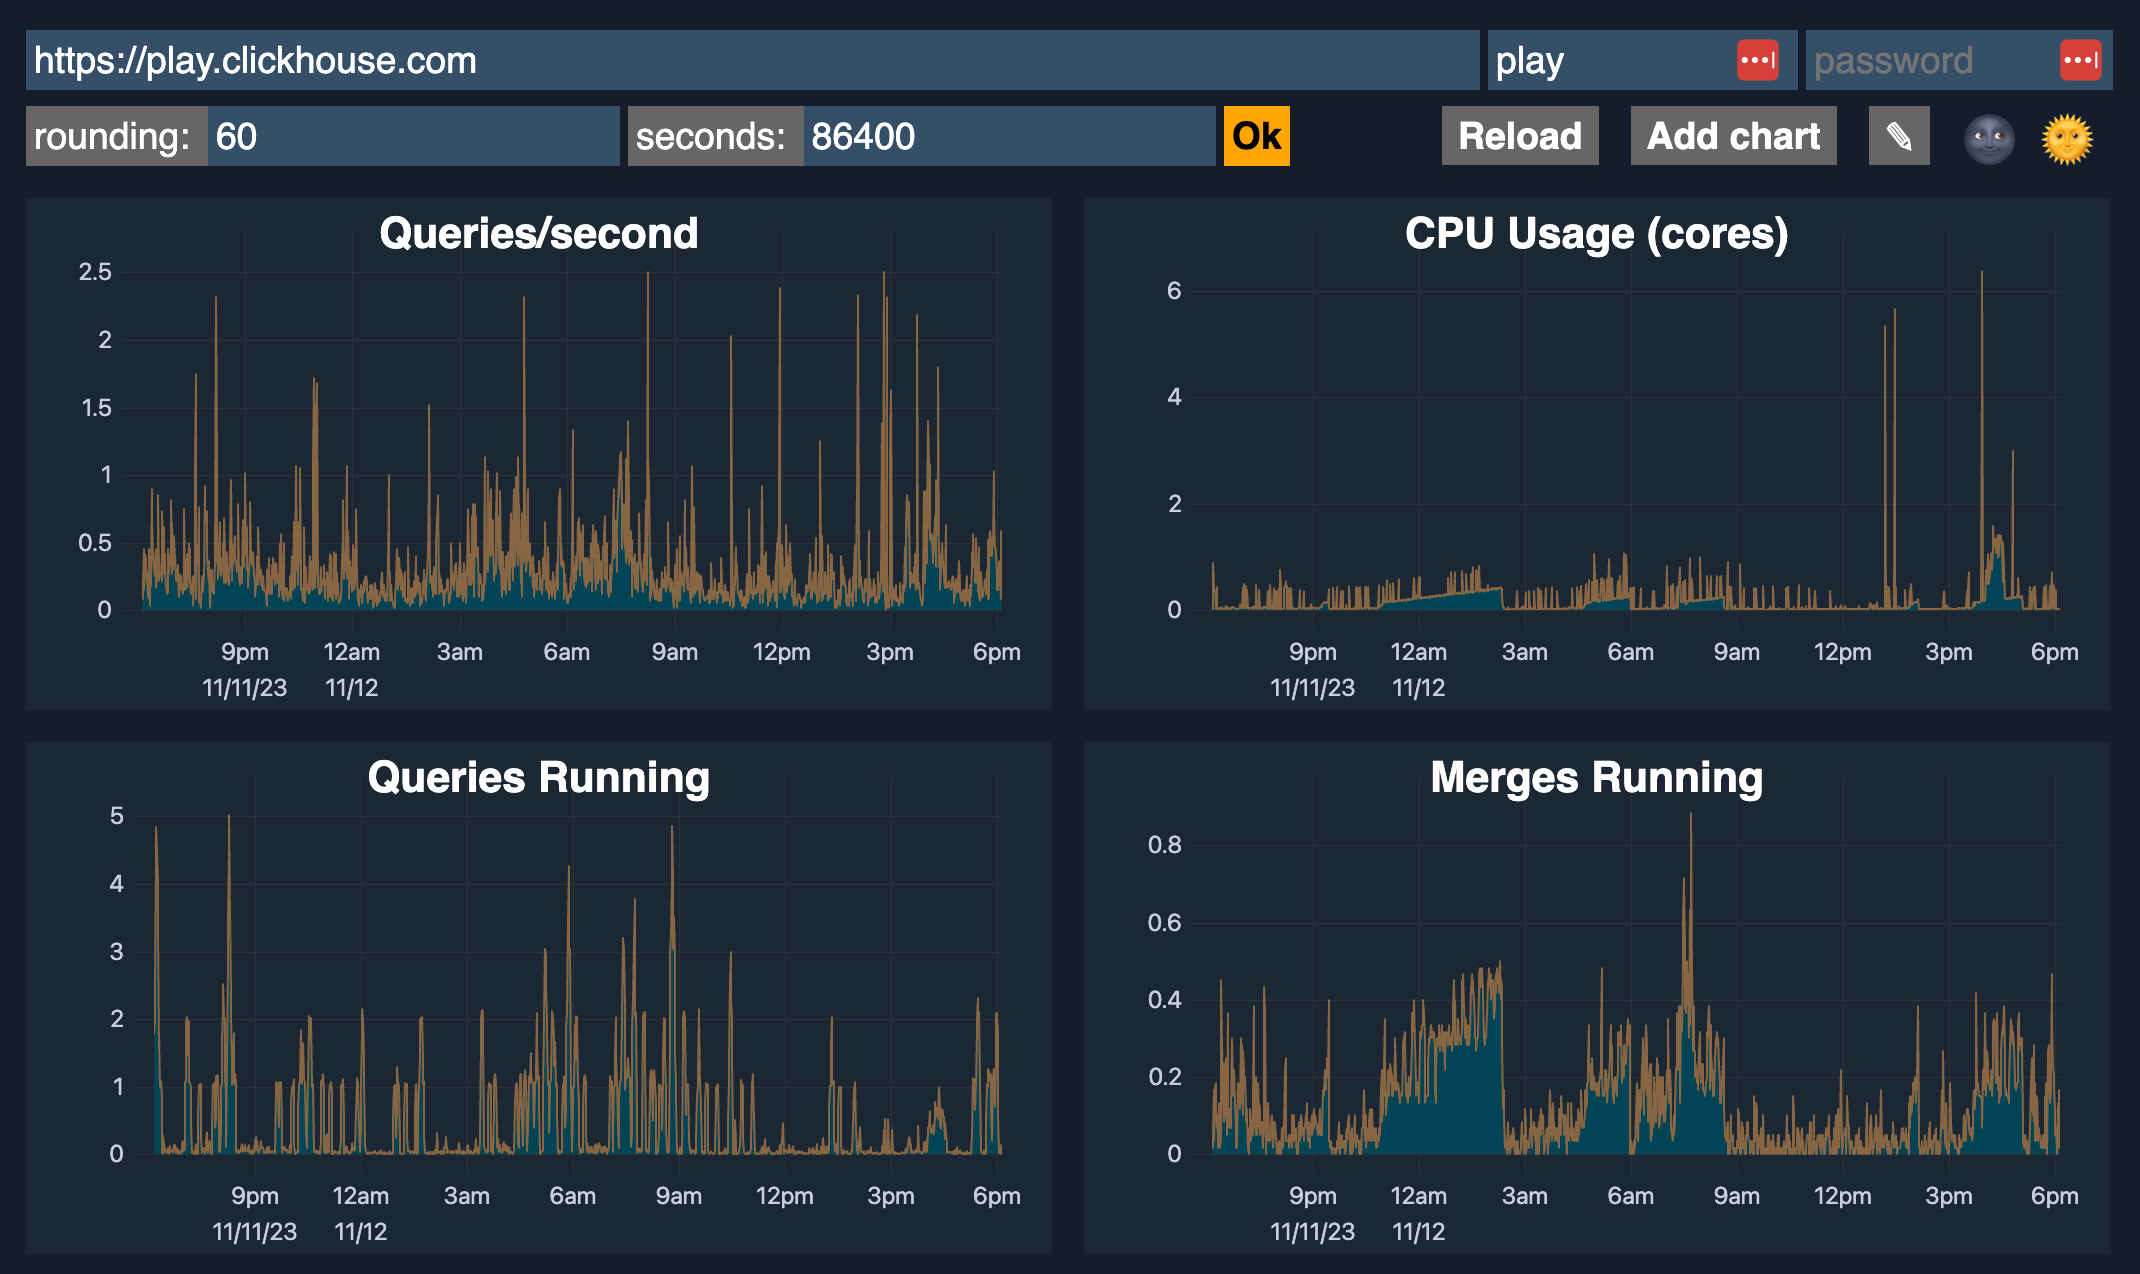 ClickHouse comes with a built-in advanced observability dashboard feature which can be accessed by `$HOST:$PORT/dashboard` (requires user and password) that shows the following metrics:
- Queries/second
- CPU usage (cores)
- Queries running
- Merges running
- Selected bytes/second
- IO wait
- CPU wait
- OS CPU Usage (userspace)
- OS CPU Usage (kernel)
- Read from disk
- Read from filesystem
- Memory (tracked)
- Inserted rows/second
- Total MergeTree parts
- Max parts for partition
## Resource Utilization {#resource-utilization}
ClickHouse also monitors the state of hardware resources by itself such as:
- Load and temperature on processors.
- Utilization of storage system, RAM and network.
This data is collected in the `system.asynchronous_metric_log` table.
## ClickHouse Server Metrics {#clickhouse-server-metrics}
ClickHouse server has embedded instruments for self-state monitoring.
To track server events use server logs. See the [logger](../operations/server-configuration-parameters/settings.md#server_configuration_parameters-logger) section of the configuration file.
ClickHouse collects:
- Different metrics of how the server uses computational resources.
- Common statistics on query processing.
You can find metrics in the [system.metrics](../operations/system-tables/metrics.md#system_tables-metrics), [system.events](../operations/system-tables/events.md#system_tables-events), and [system.asynchronous_metrics](../operations/system-tables/asynchronous_metrics.md#system_tables-asynchronous_metrics) tables.
You can configure ClickHouse to export metrics to [Graphite](https://github.com/graphite-project). See the [Graphite section](../operations/server-configuration-parameters/settings.md#server_configuration_parameters-graphite) in the ClickHouse server configuration file. Before configuring export of metrics, you should set up Graphite by following their official [guide](https://graphite.readthedocs.io/en/latest/install.html).
You can configure ClickHouse to export metrics to [Prometheus](https://prometheus.io). See the [Prometheus section](../operations/server-configuration-parameters/settings.md#server_configuration_parameters-prometheus) in the ClickHouse server configuration file. Before configuring export of metrics, you should set up Prometheus by following their official [guide](https://prometheus.io/docs/prometheus/latest/installation/).
Additionally, you can monitor server availability through the HTTP API. Send the `HTTP GET` request to `/ping`. If the server is available, it responds with `200 OK`.
To monitor servers in a cluster configuration, you should set the [max_replica_delay_for_distributed_queries](../operations/settings/settings.md#max_replica_delay_for_distributed_queries) parameter and use the HTTP resource `/replicas_status`. A request to `/replicas_status` returns `200 OK` if the replica is available and is not delayed behind the other replicas. If a replica is delayed, it returns `503 HTTP_SERVICE_UNAVAILABLE` with information about the gap.
ClickHouse comes with a built-in advanced observability dashboard feature which can be accessed by `$HOST:$PORT/dashboard` (requires user and password) that shows the following metrics:
- Queries/second
- CPU usage (cores)
- Queries running
- Merges running
- Selected bytes/second
- IO wait
- CPU wait
- OS CPU Usage (userspace)
- OS CPU Usage (kernel)
- Read from disk
- Read from filesystem
- Memory (tracked)
- Inserted rows/second
- Total MergeTree parts
- Max parts for partition
## Resource Utilization {#resource-utilization}
ClickHouse also monitors the state of hardware resources by itself such as:
- Load and temperature on processors.
- Utilization of storage system, RAM and network.
This data is collected in the `system.asynchronous_metric_log` table.
## ClickHouse Server Metrics {#clickhouse-server-metrics}
ClickHouse server has embedded instruments for self-state monitoring.
To track server events use server logs. See the [logger](../operations/server-configuration-parameters/settings.md#server_configuration_parameters-logger) section of the configuration file.
ClickHouse collects:
- Different metrics of how the server uses computational resources.
- Common statistics on query processing.
You can find metrics in the [system.metrics](../operations/system-tables/metrics.md#system_tables-metrics), [system.events](../operations/system-tables/events.md#system_tables-events), and [system.asynchronous_metrics](../operations/system-tables/asynchronous_metrics.md#system_tables-asynchronous_metrics) tables.
You can configure ClickHouse to export metrics to [Graphite](https://github.com/graphite-project). See the [Graphite section](../operations/server-configuration-parameters/settings.md#server_configuration_parameters-graphite) in the ClickHouse server configuration file. Before configuring export of metrics, you should set up Graphite by following their official [guide](https://graphite.readthedocs.io/en/latest/install.html).
You can configure ClickHouse to export metrics to [Prometheus](https://prometheus.io). See the [Prometheus section](../operations/server-configuration-parameters/settings.md#server_configuration_parameters-prometheus) in the ClickHouse server configuration file. Before configuring export of metrics, you should set up Prometheus by following their official [guide](https://prometheus.io/docs/prometheus/latest/installation/).
Additionally, you can monitor server availability through the HTTP API. Send the `HTTP GET` request to `/ping`. If the server is available, it responds with `200 OK`.
To monitor servers in a cluster configuration, you should set the [max_replica_delay_for_distributed_queries](../operations/settings/settings.md#max_replica_delay_for_distributed_queries) parameter and use the HTTP resource `/replicas_status`. A request to `/replicas_status` returns `200 OK` if the replica is available and is not delayed behind the other replicas. If a replica is delayed, it returns `503 HTTP_SERVICE_UNAVAILABLE` with information about the gap.